0%

Echarts 的食用方式

ECharts,一个使用 JavaScript 实现的开源可视化库,可以流畅的运行在 PC 和移动设备上。可以这么说,在国内,是个前端都知道这个玩意是干嘛用的,毕竟它还是出自于国人之手。

虽说如此,但是Echarts涵盖的类型实在是太广了,它给我们提供了很多配置项,但呼之而来的问题是会有点让刚接触的人有点茫然… 哪些参数是必要的?哪个参数又跟什么地方的key值相对应,缺失后就无法正常的显示…

因此就来专门讲一讲这配置项的坑以及如何通过组件的方式正确的”食用“。


其实Echarts也有自己的使用教程,但本文的重心并不是从零开始讲解Echarts,至于更多使用细节可以看官方的文档

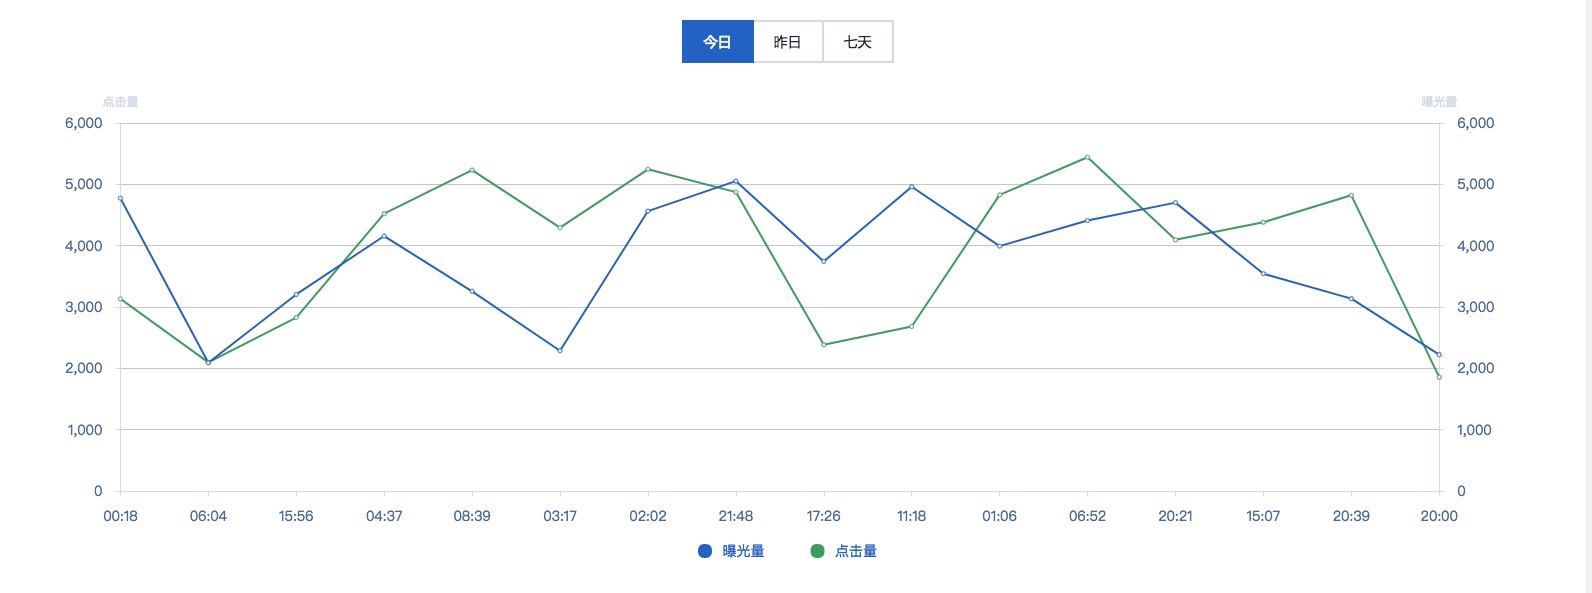
这里姑且先用折线图作示例。首先需要先引入ECharts, 我们选择好自己所需的版本后(tips: 如何选择版本,可以去看看这里),然后在</body>前插入脚本:<script src="echarts.min.js"></script>

随后通过echarts提供的 API 初始化目标容器节点:

1
2
// 初始化 echarts
var myChart = echarts.init(document.getElementById('main'));

接着我们需要填写配置项:

1
2
3
4
5
6
7
8
9
10
11
12
13
14
15
16
17
18
19
20
21
22
23
24
25
26
27
28
29
30
31
32
33
34
35
36
37
38
39
40
41
42
43
44
45
46
47
48
49
50
51
52
53
54
55
56
57
58
59
60
61
62
63
64
65
66
67
68
69
70
71
72
73
74
75
76
77
78
79
80
81
82
83
84
85
86
87
88
89
90
91
92
93
94
95
96
97
98
99
100
101
102
103
104
105
106
107
108
109
110
111
112
113
114
115
116
117
118
119
120
121
var config = {
// 全局 tooltip ,
tooltip: {
show: true,
// 坐标轴触发
trigger: 'axis'
},
// 图例组件,也就是提供显示或隐藏某一条数据信息开关
legend: {
// 组件在底部显示
bottom: '0px',
// 图例每项之间的间隔
itemGap: 46,
// 图例的数据数组, 省略则自动从 series.name 中获取
// 但我们需要定制样式,因此我们添上去上去
data: [
{
name: '曝光量',
icon: 'circle'
},
{
name: '点击量',
icon: 'circle'
}
],
// 文字样式
textStyle: {
color: '#276dcc',
fontSize: 14
}
},
// 重设全局调色盘的颜色,比如当前涉嫌图示例中有两条数据
// 那这两条数据就会取得我们当前设置颜色作为展示
color: ['#42a66a', '#276dcc'],
// 网格布局
grid: {
// 下面三个是离容器的位置
left: '3%',
right: '4%',
bottom: '40px',
// 坐标刻度,默认是false
containLabel: true
},
// X轴配置
xAxis: {
type: 'category',
boundaryGap: false,
// 坐标轴配置
axisLine: {
lineStyle: {
color: '#d6dfea'
}
},
// 坐标轴上的 label 样式
axisLabel: {
margin: 18,
fontSize: 14,
color: '#56749d'
},
// 类目数据,只有在 type: 'category' 中有效。
// 一般情况下我们并不会手动写死数据进去,而是通过 Ajax 请求数据来展示
data: []
},
// Y轴配置
yAxis: [
{
// 数值轴
type: 'value',
name: '点击量',
// 左侧显示
position: 'left',
// 下面的样式不再多说
axisLine: {
lineStyle: {
color: '#d6dfea'
}
},
axisLabel: {
margin: 18,
fontSize: 14,
color: '#56749d'
}
},
{
type: 'value',
name: '曝光量',
position: 'right',
axisLine: {
lineStyle: {
color: '#d6dfea'
}
},
axisLabel: {
margin: 18,
fontSize: 14,
color: '#56749d'
}
}
],
// 系列列表, 这个是数据的关键所在
series: [
// 如果 legend.data 设置了数据的话,那么 series 的数目需要和 legend.data 的数目一致。
// 否则图表会不工作 !!
{
name: '点击量',
// 图表的类型,在这个示例中我们使用是折线图
type: 'line',
yAxisIndex: 1,
// 系列中的数据内容数组
// 同样的,我们主要展示的数据来自于服务端
data: []
},
{
name: '曝光量',
type: 'line',
// 折线图一维数据可能是这种形式的数组
// [1, 2, 3, 1, 4]
data: []
}
]
};

随后可以通过 Ajax 获取数据,再使用setOption来设置选项:

1
2
3
4
5
6
7
8
9
10
11
$.ajax({
url: url,
method: 'GET',
data: data
}).done(function(res) {
config.series[0].data = res.data.click;
config.series[1].data = res.data.exposure;
config.xAxis.data = res.data.xAxis;

myChart.setOption(option);
});

如此,这样我们定义的 echarts 就完成啦~


Vue 组件

vue中封装组件也不难,大致如下:

1
2
3
4
5
6
7
8
9
10
11
12
13
14
15
16
17
18
19
20
21
22
23
24
25
26
27
28
29
30
31
32
33
34
35
36
37
38
39
40
41
42
43
44
45
46
47
48
49
50
51
52
53
54
55
56
57
58
59
60
61
62
63
64
65
66
67
68
69
70
71
72
73
74
75
76
77
78
79
80
81
82
83
84
85
86
87
88
89
90
91
92
93
94
95
96
97
98
99
100
101
102
103
104
105
106
107
108
109
110
111
112
113
114
115
116
117
118
119
120
121
122
123
124
125
126
127
128
129
130
131
132
133
134
135
136
137
138
139
140
141
142
143
<template>
<div :class="['data-echart', echartClass ]">
<div class="data-echart__header">
<slot name="title">
<div class="header__title">
<span v-if="title" class="title-name">{{title}}</span>
<el-popover
v-if="tooltip"
ref="tooltip"
placement='bottom'
trigger='hover'>
<div v-html="tooltip"></div>
</el-popover>
<i v-if="tooltip" class="el-icon-question" v-popover:tooltip></i>
</div>
</slot>
</div>
<div :id="echartId" class="echart__main"></div>
</div>
</template>

<script>
import echarts from 'echarts';

export default {
name: 'echart',
props: {
title: {
type: String,
default: ''
},
tooltip: {
type: String,
default: ''
},
echartClass: {
type: String,
default: ''
},
option: {
type: Object,
default() {
return {};
}
},
loading: {
type: Boolean,
default: false
}
},
computed: {
domEchartId() {
return (document || window.document).getElementById(this.echartId);
}
},
data() {
return {
// 随机生成一个ID
echartId: this.randomChar(20),
myChart: null
};
},
watch: {
option: {
deep: true,
handler(newVal) {
this.update(newVal);
}
},
loading(newVal) {
this.toggleLoading(newVal);
}
},
mounted() {
this.init();
},
methods: {
// 调起loading
toggleLoading(flag) {
flag ? this.myChart.showLoading() : this.myChart.hideLoading();
},
init() {
this.myChart = echarts.init(this.domEchartId);

this.myChart.on('click', (params) => {
this.$emit('clickEchart', params);
});

// 绘制图表
this.myChart.setOption(this.option);
// Object.keys(this.data).length !== 0 && this.myChart.setOption(this.data);
},
update(data) {
this.myChart.setOption(data);
},
/**
* 生成随机字符串
* @param { Number } len - 指定随机字符串的长度
*/
randomChar(len) {
const x = '0123456789qwertyuioplkjhgfdsazxcvbnmQWERTYUIOPASDFGHJKLZXCVBNM';

let tmp = '';
for (let i = 0; i < len; i++) {
tmp += x.charAt(Math.ceil(Math.random() * 100000000) % x.length);
}

return tmp;
},
}
};
</script>

<style lang='scss' scoped>
@import '~Scss/theme';

.data-echart {
display: flex;
flex-direction: column;
width: 100%;
height: 100%;
overflow: hidden;
}
.data-echart__header {
width: 100%;
}
.header__title {
.title-name {
font-size: 16px;
color: $f-color--title;
font-weight: 600;
}
.el-icon-question {
font-size: 18px;
color: $f-color--tip;
}
}
.echart__main {
flex: 1;
width: 100%;
height: 100%;
}
</style>

我们需要将组件放入一个设有高度的容器上:

1
2
3
<div class="container" style="height: 600px;">
<echart :option="charts.option"></echart>
</div>

调用的方式也面类似。首先声明一个基础的配置作为模板,在通过 ajax 拿到数据。通过动态数据传入组件内,组件watch到数据变化后立即重新渲染:

1
2
3
4
5
6
7
8
9
10
11
12
13
14
15
16
17
18
19
20
21
22
23
24
25
// 某处集中封装的 ajax 请求
import API from 'Common/apis'

// 同上配置
const config = {...}

export default {
data() {
return {
charts: {
title: 'My charts'
option: config
}
}
},
created() {
API.getChartData()
.then(res => {
let data = res.data
this.charts.option.xAxis.data = data.xAxis;
this.charts.option.series[0].data = data.click;
this.charts.option.series[1].data = data.exposure;
})
}
}
「请笔者喝杯奶茶鼓励一下」

欢迎关注我的其它发布渠道